
We analysed six months of municipal electricity invoices before Soluno’s intervention (August 2024 to January 2025) against the same calendar months one year later (August 2025 to January 2026). By normalising for annual tariff escalation, the results isolate the real operational impact of Soluno’s TOU arbitrage and battery dispatch strategy.
Consumption mix shift
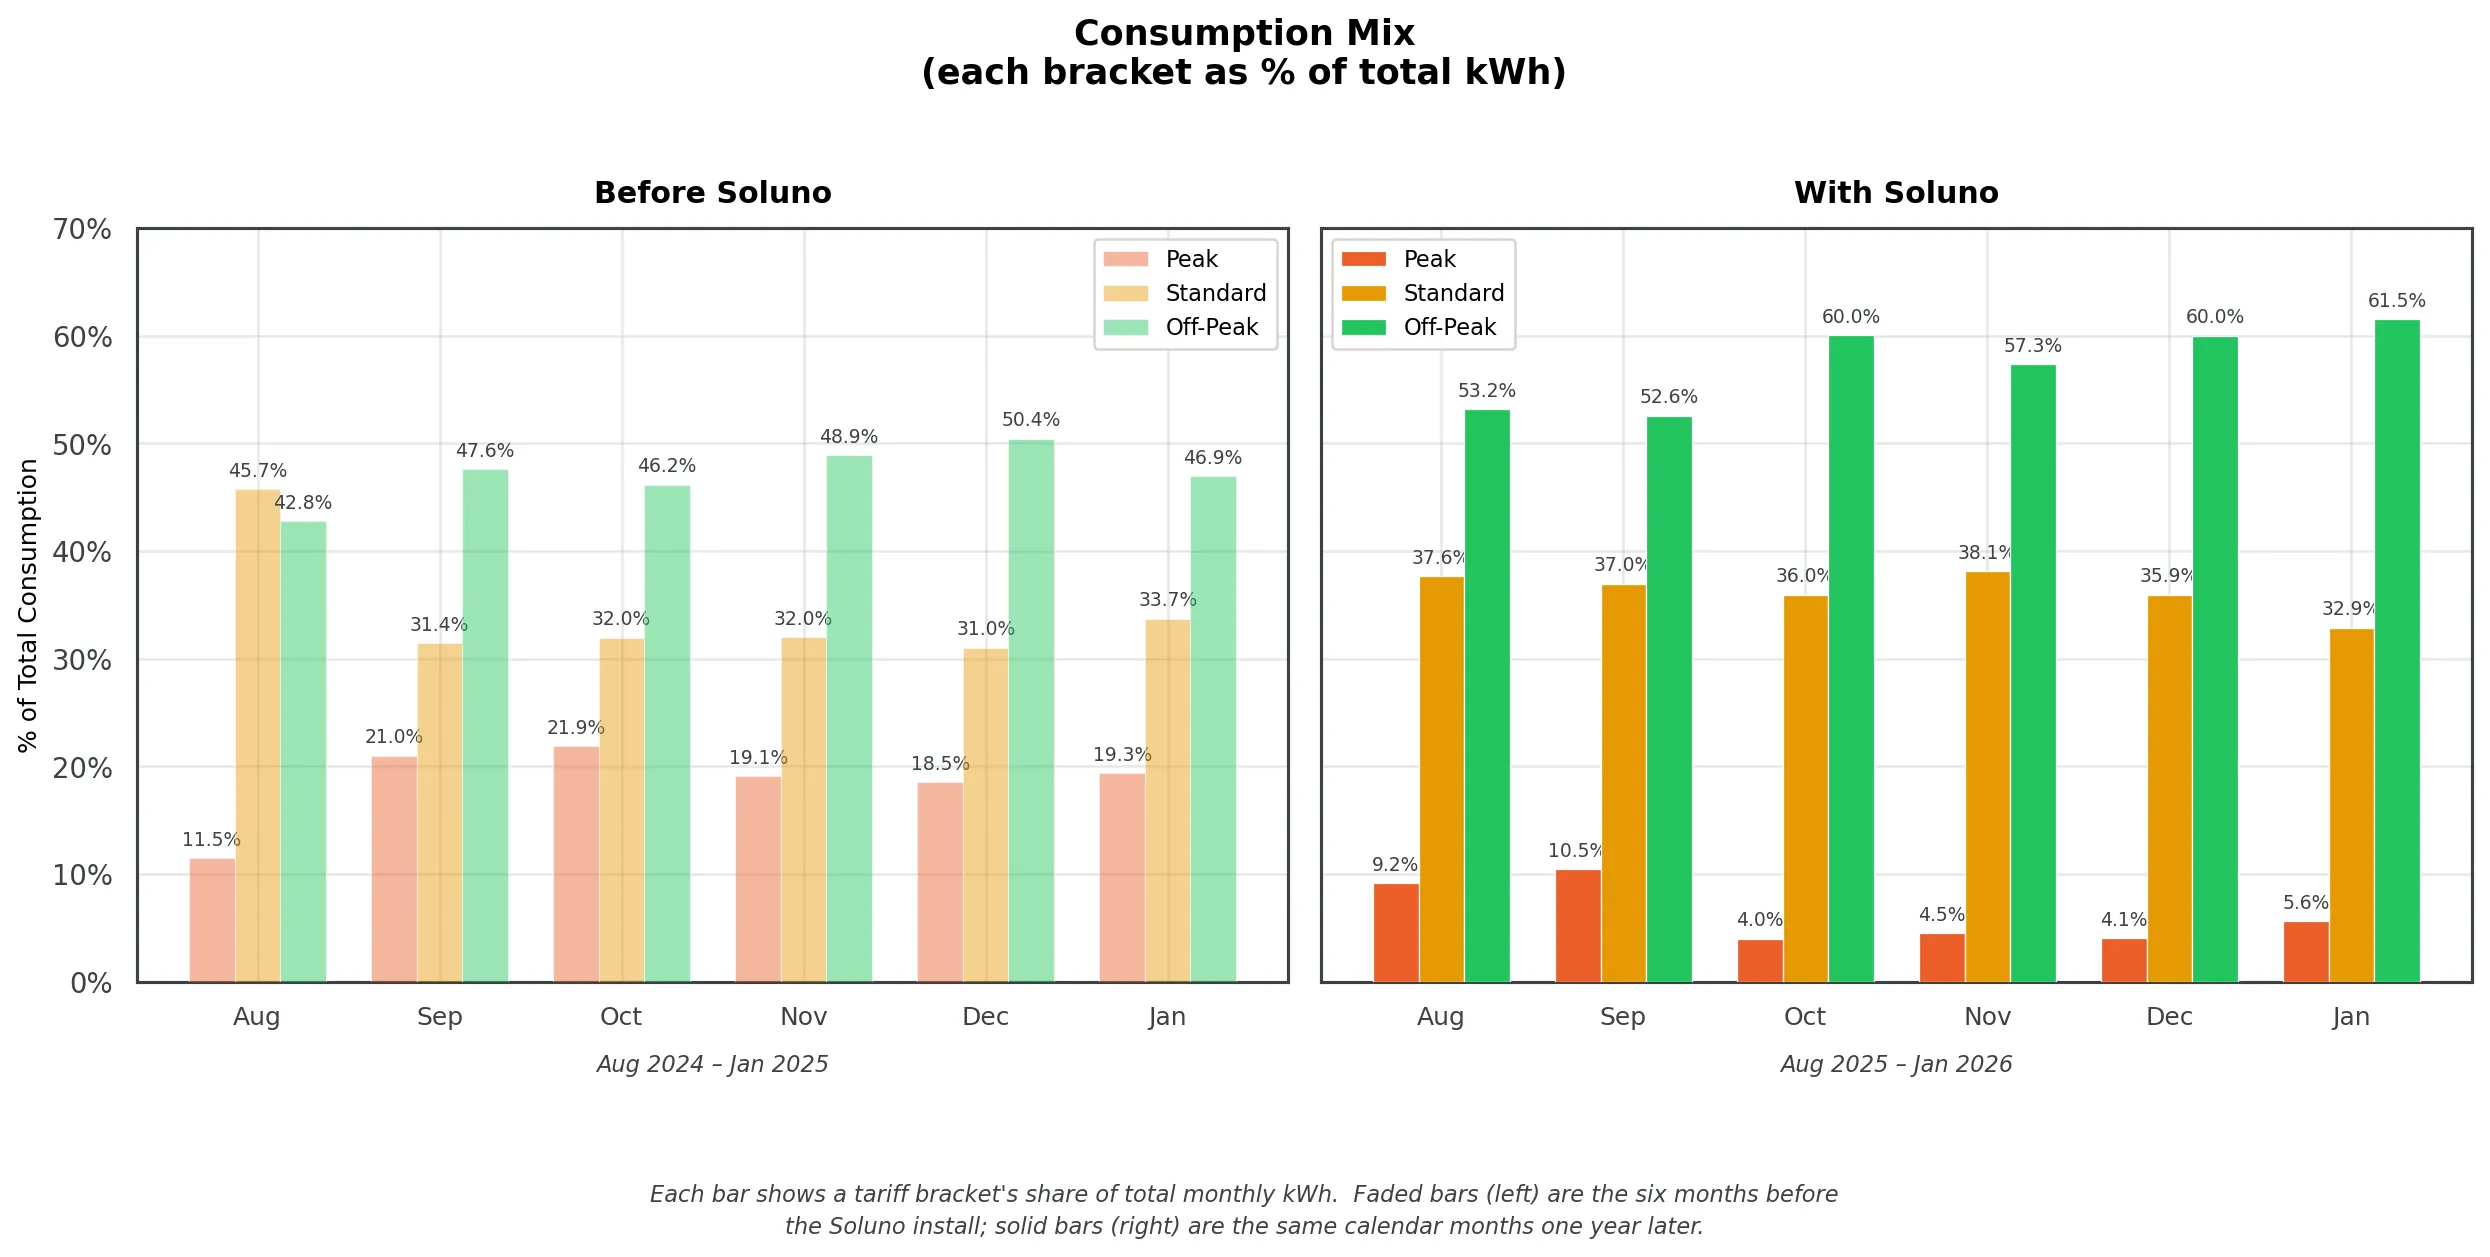
The most visible impact of Soluno’s optimisation is the reshaping of the hotel’s consumption profile. Before Soluno, peak electricity accounted for up to 22 percent of monthly usage, the most expensive bracket on the municipality’s time-of-use tariff. After Soluno, peak consumption dropped to as low as 4 percent, with load systematically shifted into off-peak and standard periods. This mix shift is the primary mechanism through which Soluno delivers savings without reducing total energy consumption.
Energy cost: tariff-normalised comparison
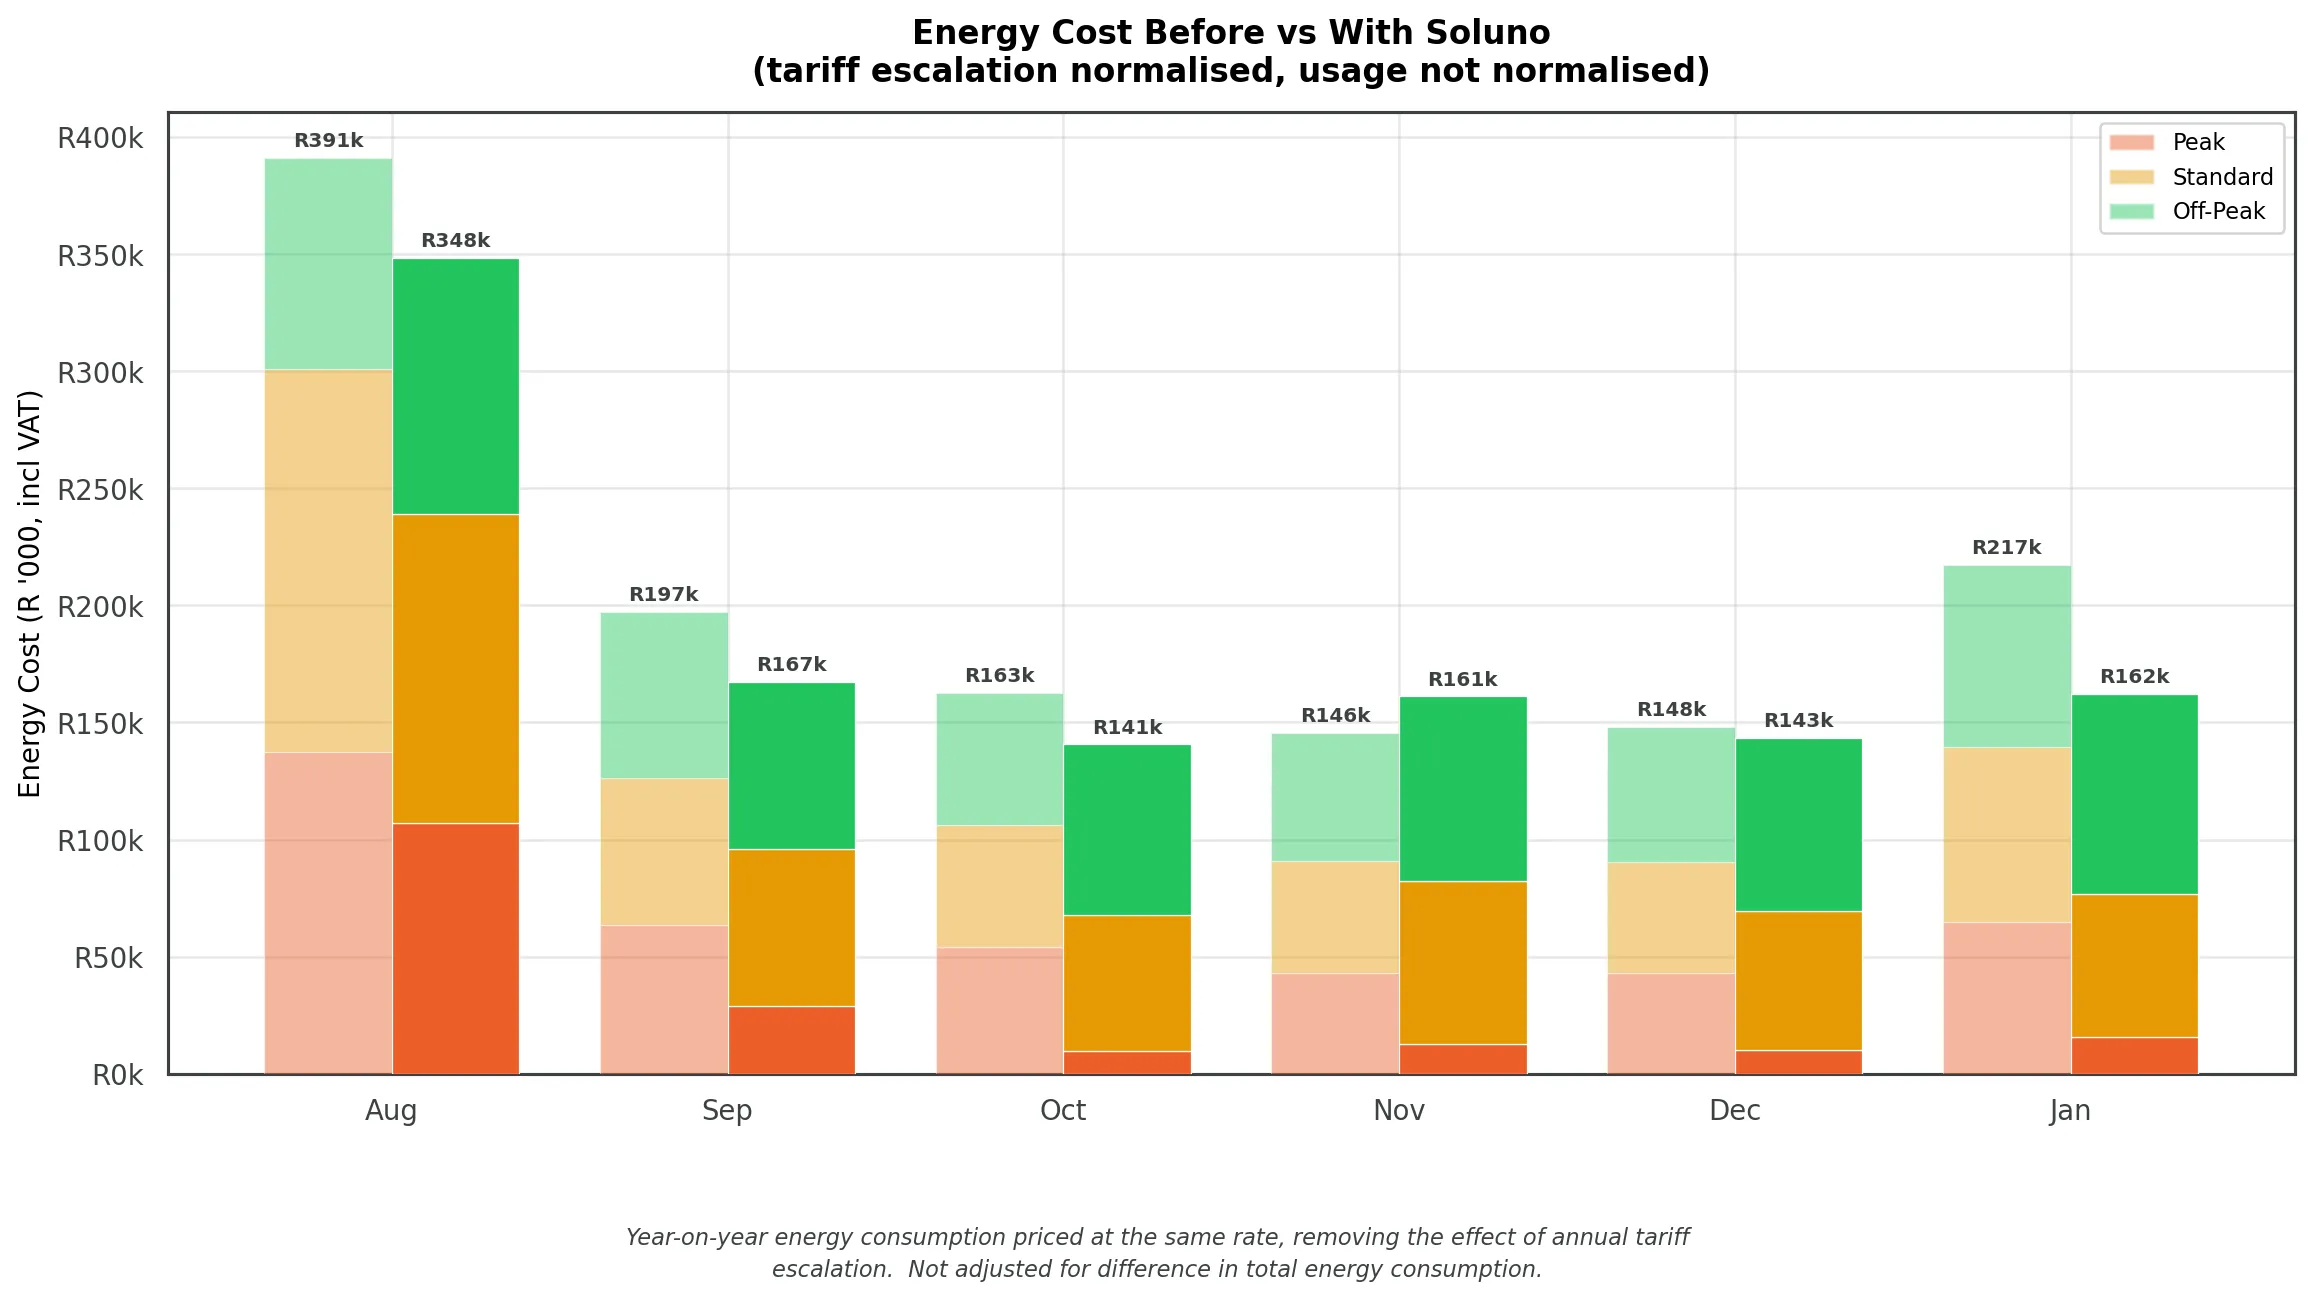
To remove the distortion of annual tariff increases, we priced both periods at the same effective tariff rates. The result: consistent cost reductions in five of six months, with an average monthly saving of approximately R23,000. The winter months (June to August) show the largest absolute savings because the TOU price differential between peak and off-peak is widest during Eskom’s high-demand season, exactly where intelligent battery dispatch creates the most value.
Pure mix-shift effect, usage normalised
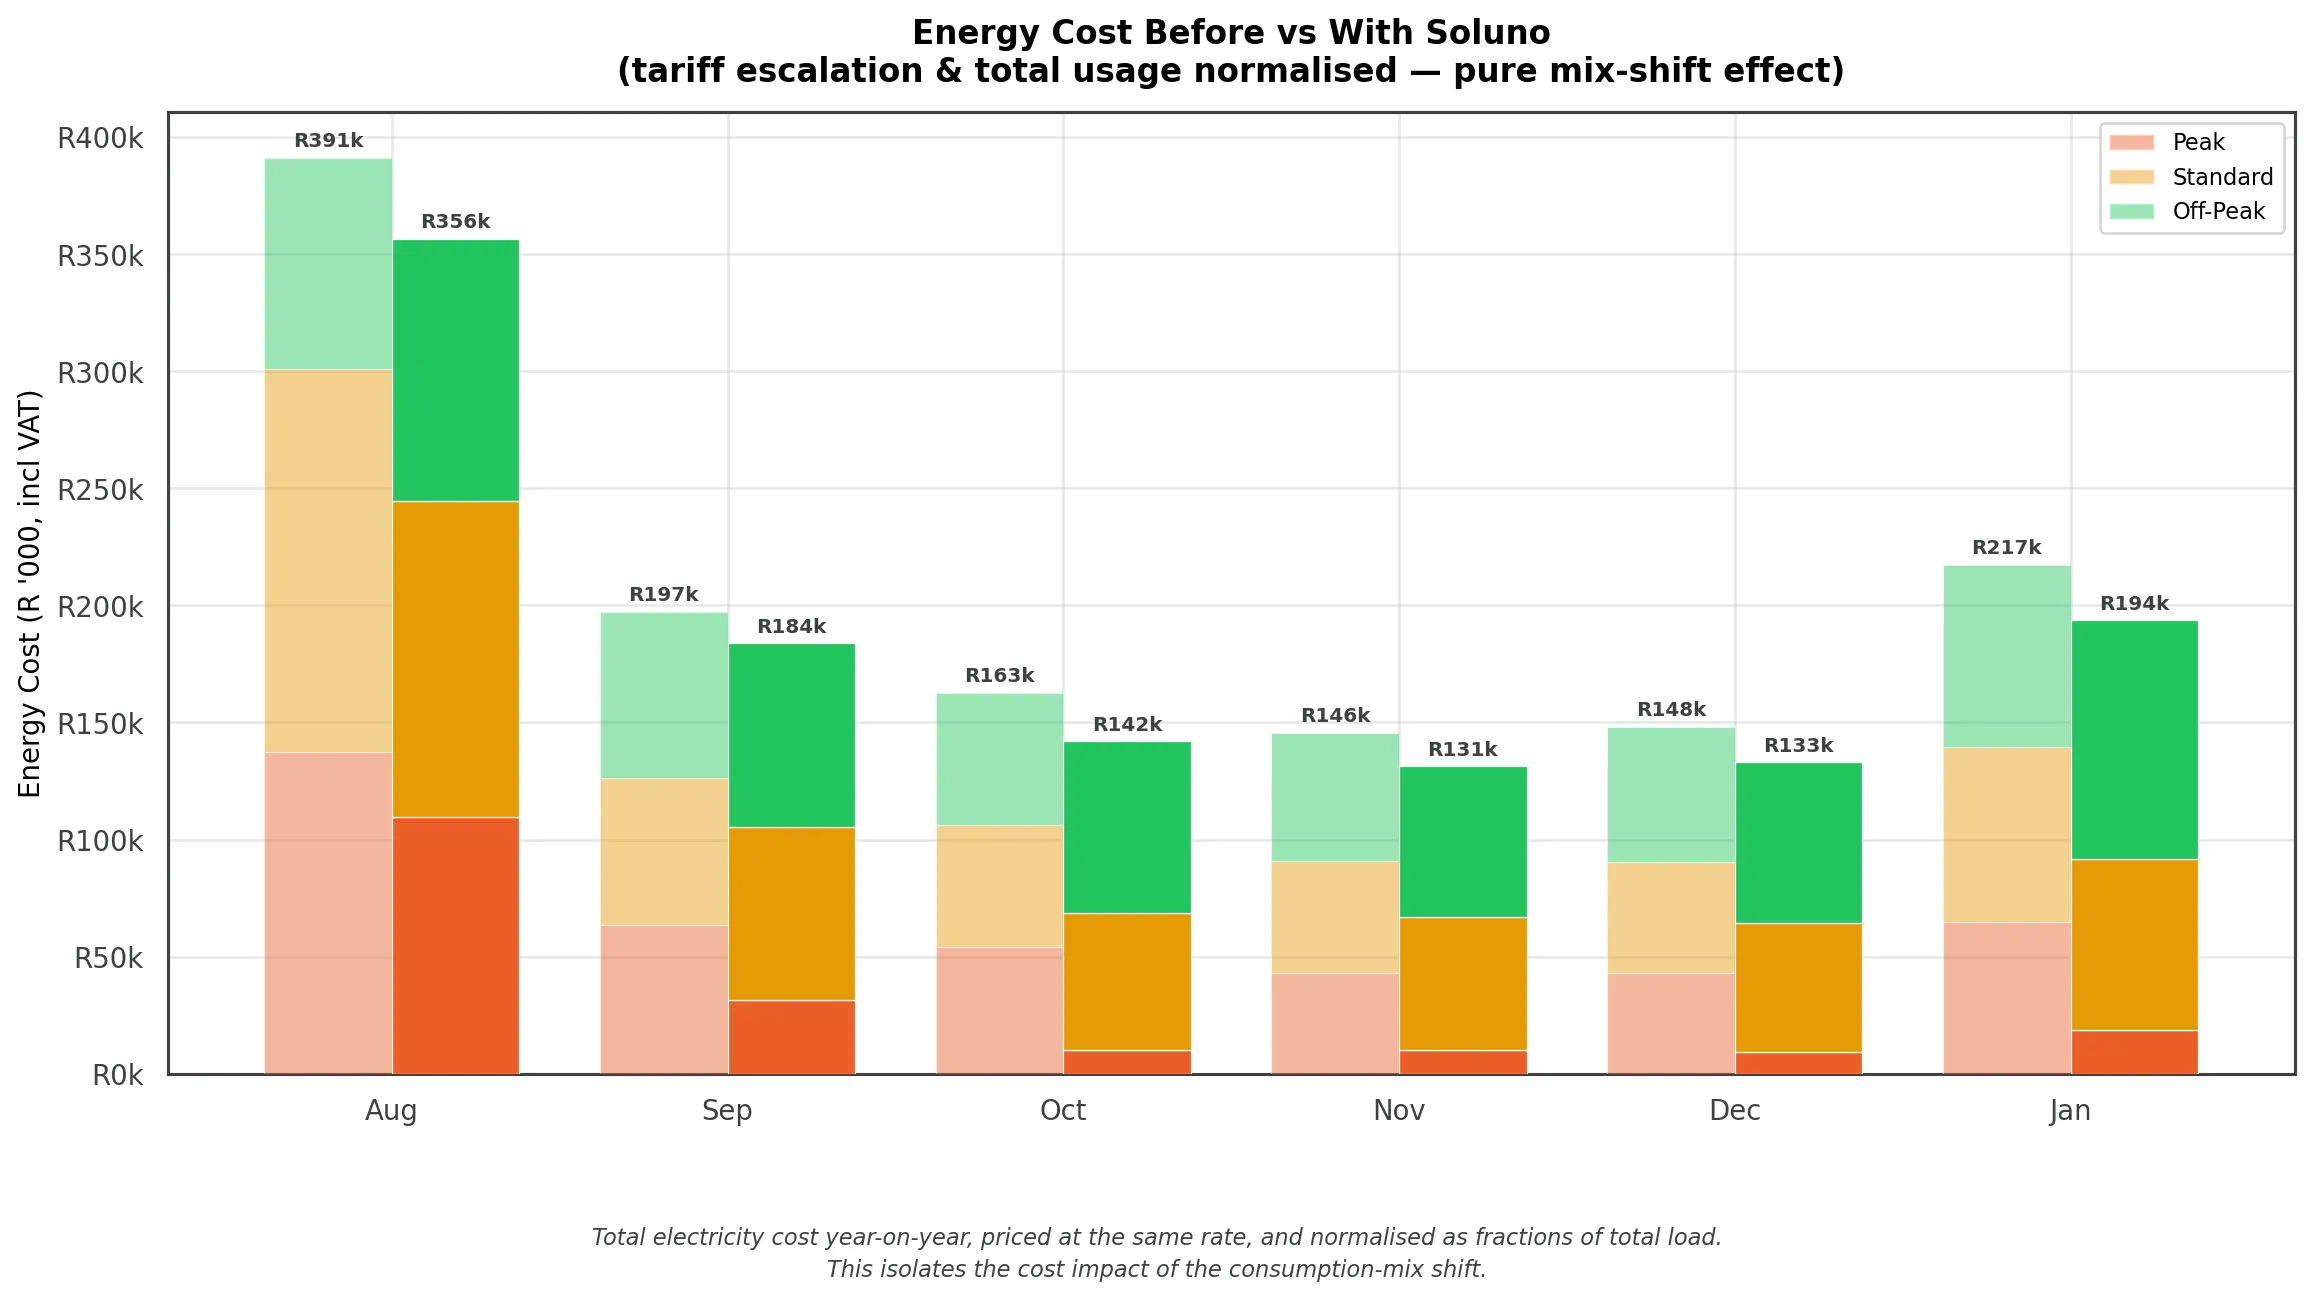
This view goes one step further: it holds both tariff rates and total energy consumption constant, isolating the pure effect of Soluno’s consumption-mix optimisation. By applying the after-period consumption fractions to the before-period total kWh at before-period tariff rates, we can see the cost difference attributable solely to shifting load between tariff brackets. The result confirms that Soluno’s TOU arbitrage strategy, not reduced consumption, is the primary driver of cost savings.
Methodology
Analysis is based on actual municipal invoice data across eight billing periods (May 2024 to February 2025, and April 2025 to March 2026). The before period is August 2024 to January 2025; the after period is August 2025 to January 2026. Tariff normalisation uses effective per-kWh rates derived from invoice amounts, inclusive of VAT. Consumption brackets are classified as peak, standard, and off-peak per the municipal TOU schedule. Demand charges, service levies, and reactive power charges are excluded from the energy cost comparison to isolate the variable consumption component.
Want to know what your solar asset could save?
How Much Do I Save?